VizMaster – Insightful Business Intelligence with 4D Data Visualization
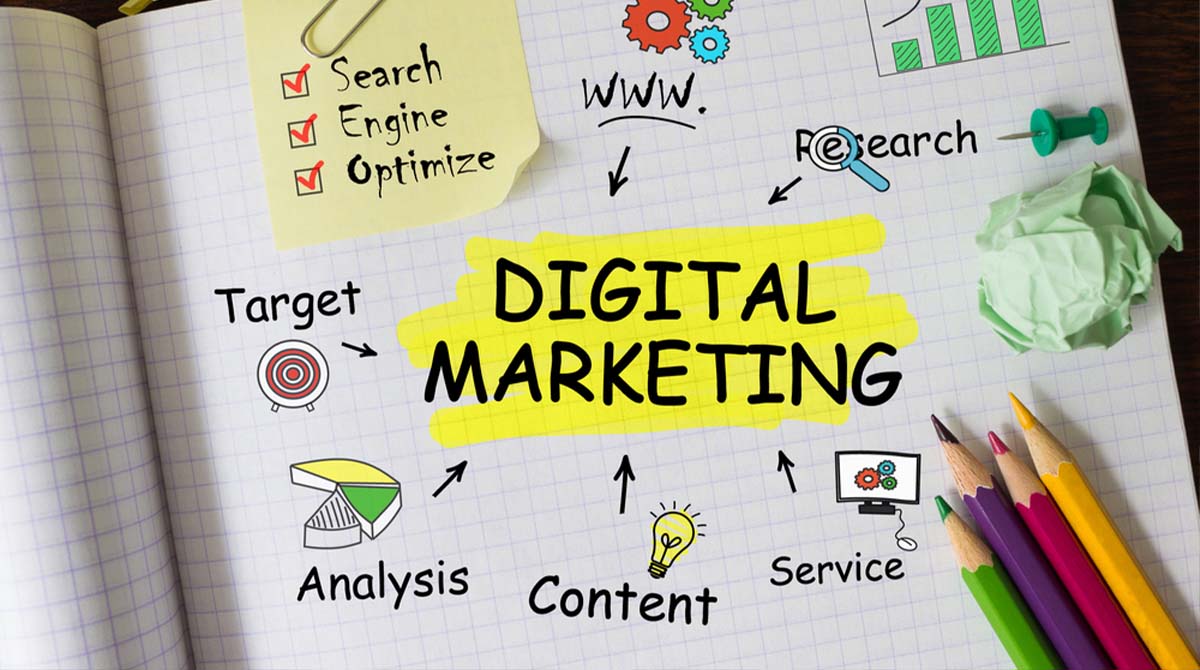
Market dynamics have made it imperative for companies to assertively adapt for greater customer engagement at every stage of interaction, while objectively assessing the returns from such marketing investment. What should they do to deal with it?
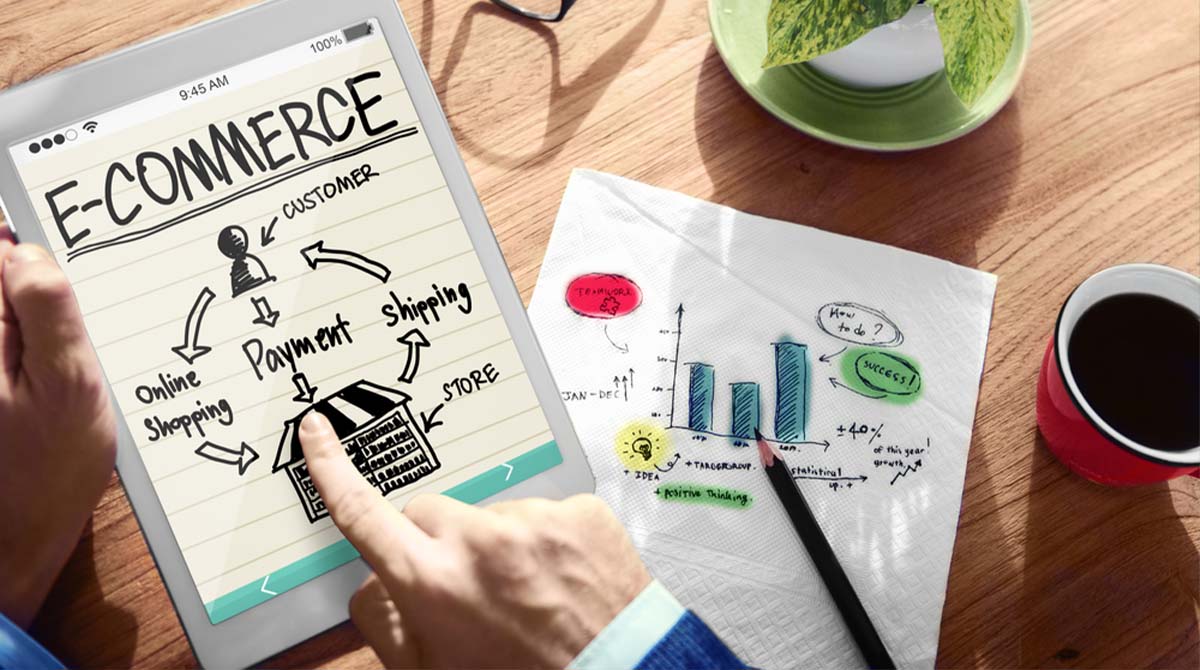
Finally, Businesses are realizing the value in business intelligence & analytics and increasingly making decisions based on the facts rather than intuition. Companies have improved customer conversion, identified what behaviors causes churn and increased revenue by a significant figure. Customers interact with companies through various touch points such as social media, call centers, retail stores etc. But there is a gap, in many companies, Bi & Analytics team can’t keep up with the requirement and demand from their business colleagues. This will lead to several problems which are unfortunate to face:
- Making decisions without the complete data, because internal clients can’t wait. Most of the times, analytics team don’t use the external data like social media, data captured through mobile applications, census data which leads to make improper decisions.
- Creating dashboards using traditional sources, it leads to invest a lot of time of higher management in just compiling the data.
- Investing huge time in doing simple analysis will lead to delay in output with no result ultimately.
Above challenges raised some key questions like what companies should do to improve the BI & Analytics practice? What kind of data they should use to enhance the quality of decision making?
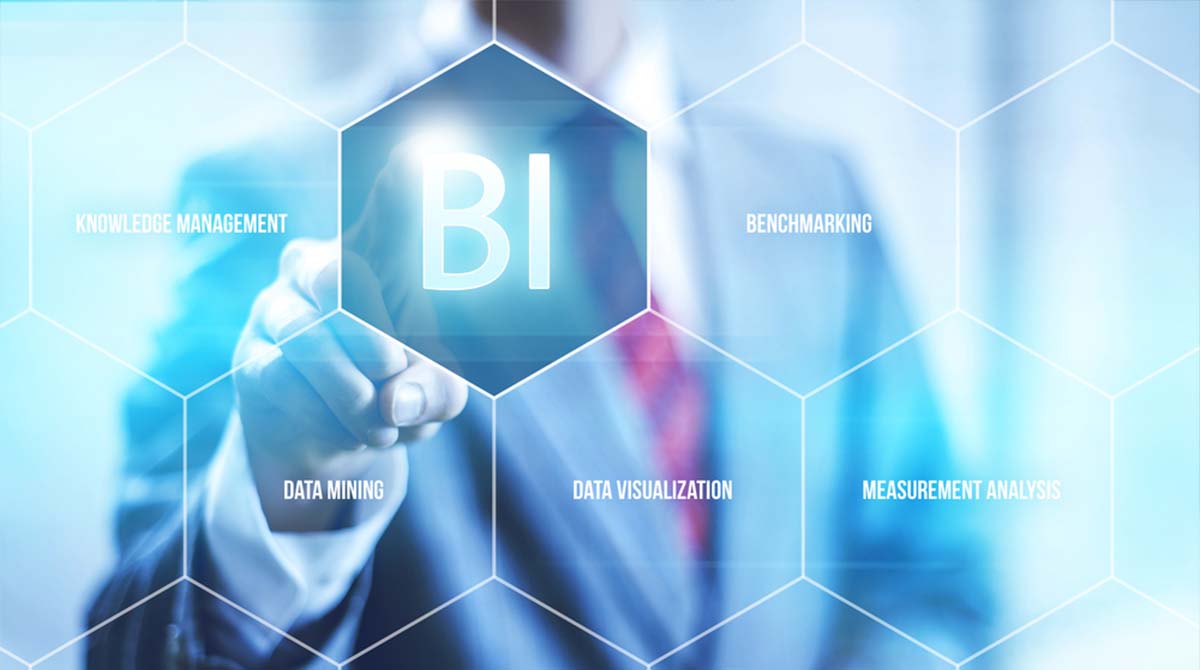
Any potential solution? – Exploring and visualizing the business growth from new perspectives
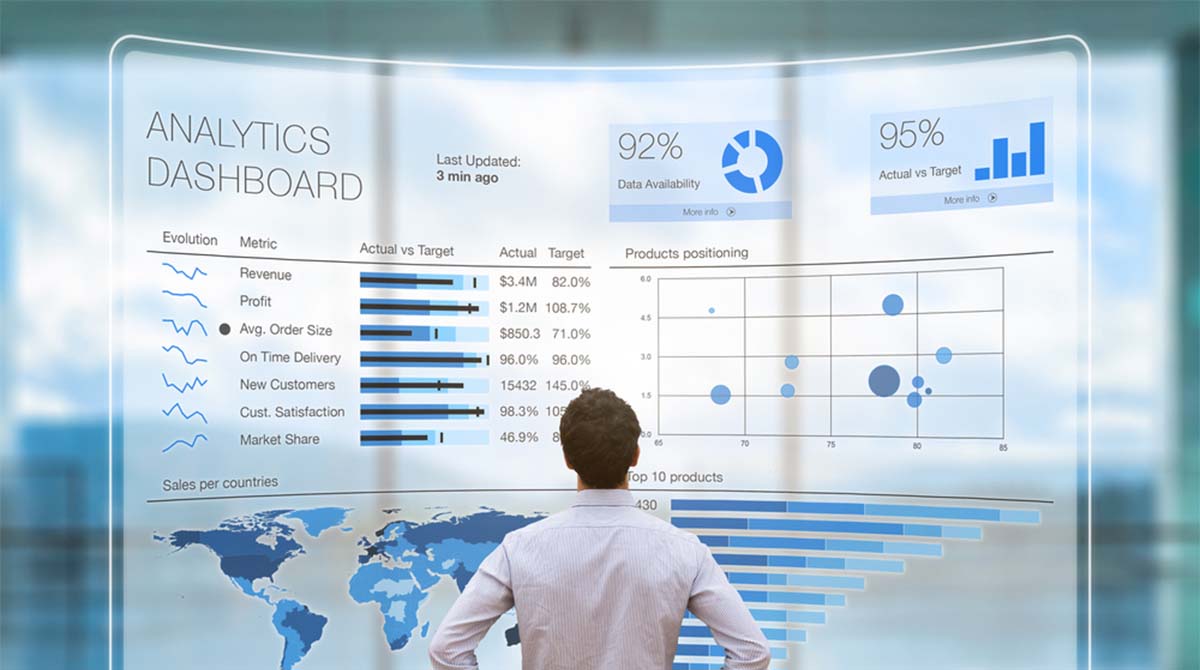
BI tools were complex in the past, wherein modern analysis tools are much simpler to use: meaning the average businessperson can often access them to conduct their own queries and produce their own reports. But users need significant technical and analytics expertise, which meant your average business person needs to partner with someone in BI or IT for any queries or analysis. This is particularly easy and the right fit if the application can be configured as a dashboard,
- Enabling business users to get a view into the metrics which they want to perform
- Representing data on world map
- Representing data on world map
- Analyzing social media data
- Target the right set of customers using census data
The requirement of making right decision will lead to a tectonic shift in the way companies create and also in the way they leverage data to navigate business hurdles.
Here’s what Bluestar Technology Solutions’s ability to boast about experimentation and evidence comes from technological advancements in the form of VizMaster.
VizMaster simplifies the big data analytics environment into a single application on top of the powerful Hadoop platform. It is the only end-to-end big data analytics application for Hadoop designed to make data simple for everyone, VizMaster combines self-service data integration, analytics and visualization functionality that provides the fastest time to insights.
It allows users to perform analytics on large volumes of data that is stored in the Hadoop Distributed File System. It allows us to perform basic operations on the data like Filtering, Joining, Grouping, Sorting etc. and also allows us to create a variety of visualizations based on this data.
What is your company doing to make faster and accurate decisions?